This function plots a panel of two graphics for one count series
(previously generated by format_data()):
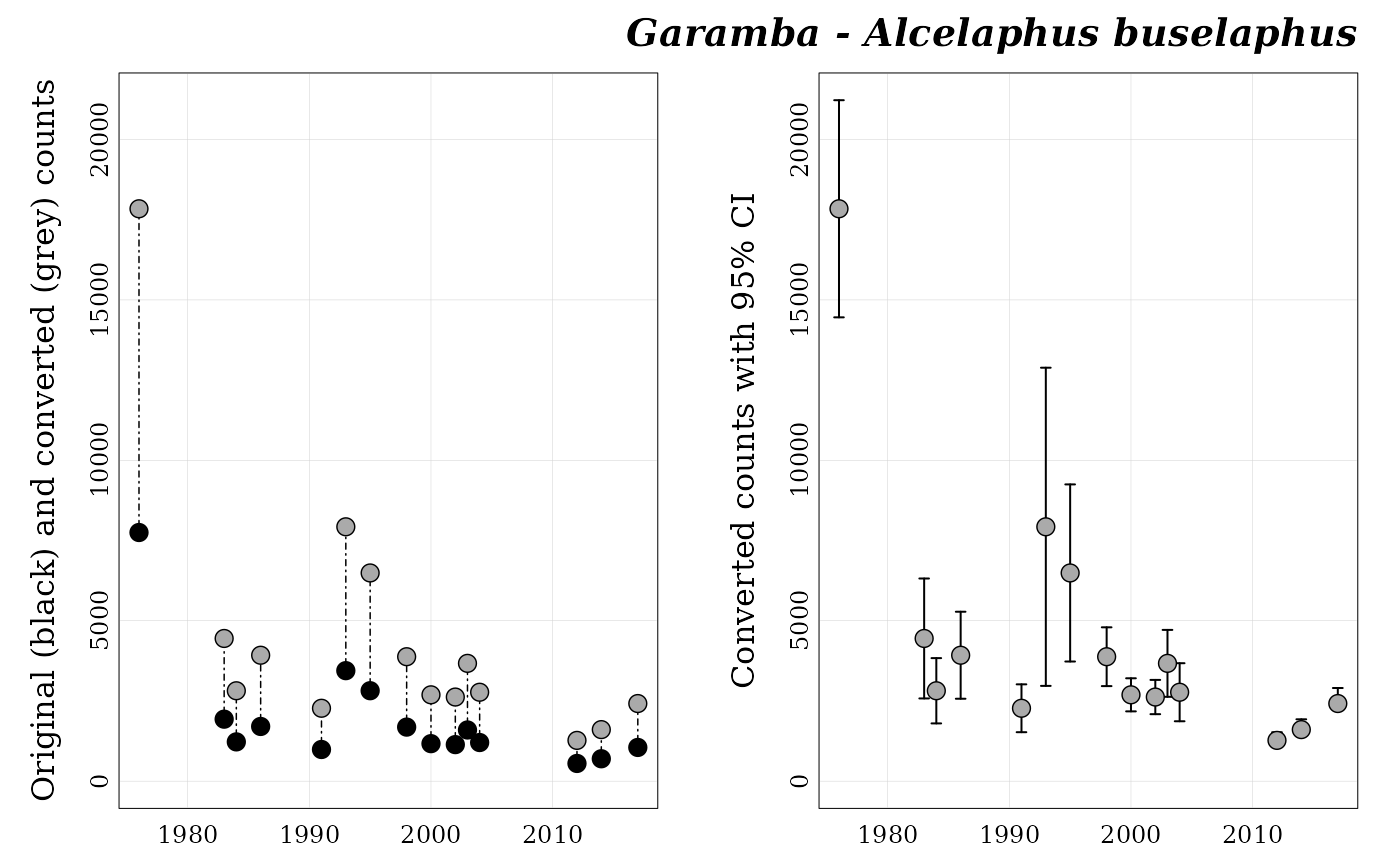
on the left side, scatter plot overlapping original (black points) and converted counts (grey points);
on the right side, scatter plot of converted counts with boundaries of the 95% confident interval.
Arguments
- series
a
characterstring. The count series names (can be retrieved by runninglist_series()).- title
a
logical. IfTRUE(default) a title (series name) is added.- path
a
characterstring. The directory in which count series have been saved by the functionformat_data().- path_fig
a
characterstring. The directory where to save the plot (ifsave = TRUE). This directory must exist and can be an absolute or a relative path.- save
a
logical. IfTRUE(default isFALSE) the plot is saved inpath_fig.
Examples
## Load Garamba raw dataset ----
file_path <- system.file("extdata", "garamba_survey.csv",
                         package = "popbayes")

garamba <- read.csv(file = file_path)

## Create temporary folder ----
temp_path <- tempdir()

## Format dataset ----
garamba_formatted <- popbayes::format_data(
  data              = garamba,
  path              = temp_path,
  field_method      = "field_method",
  pref_field_method = "pref_field_method",
  conversion_A2G    = "conversion_A2G",
  rmax              = "rmax")
#> ✔ Detecting 10 count series.

## Get series names ----
popbayes::list_series(path = temp_path)
#>  [1] "garamba__alcelaphus_buselaphus"  "garamba__giraffa_camelopardalis"
#>  [3] "garamba__hippotragus_equinus"    "garamba__kobus_ellipsiprymnus"
#>  [5] "garamba__kobus_kob"              "garamba__loxodonta_africana"
#>  [7] "garamba__ourebia_ourebi"         "garamba__redunca_redunca"
#>  [9] "garamba__syncerus_caffer"        "garamba__tragelaphus_scriptus"

## Plot for Alcelaphus buselaphus at Garamba ----
popbayes::plot_series("garamba__alcelaphus_buselaphus", path = temp_path)