Plots a sampling as a chessboard of dimensions t x q, with
t, the number of transects, and
q, the number of quadrats.
gg_chessboard(nodes, xlab = "Transect", ylab = "Quadrat")Arguments
- nodes
a
data.framewith (at least) the following three columns:node,transect, andquadrats. Must be the output if the functioncreate_node_labels().- xlab
a
characterof length 1. The title of the top axis. Default is'Transect'.- ylab
a
characterof length 1. The title of the left axis. Default is'Quadrat'.
Value
A ggplot2 object.
Examples
library("chessboard")
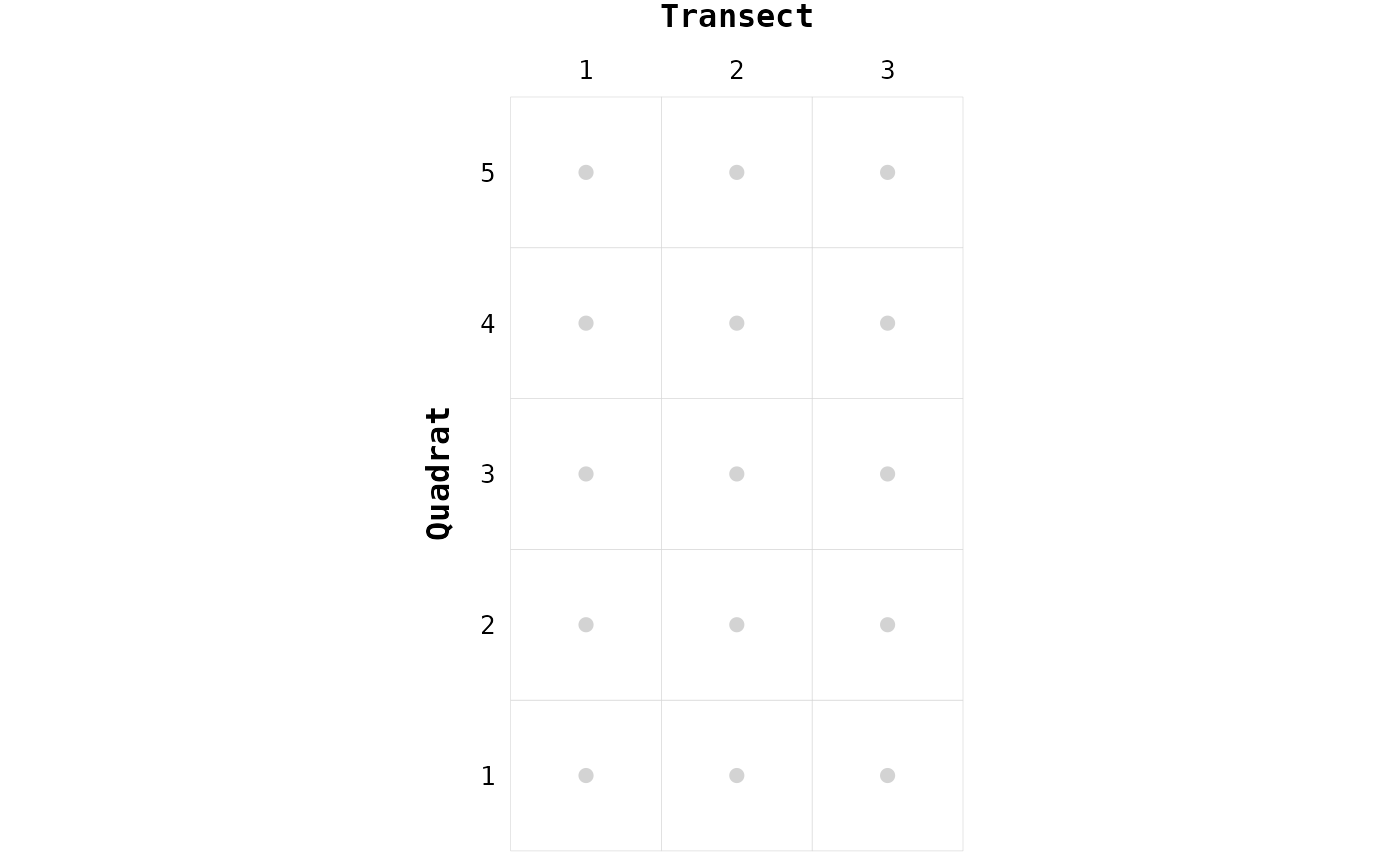
# Two-dimensional sampling ----
sites_infos <- expand.grid("transect" = 1:3, "quadrat" = 1:5)
nodes <- create_node_labels(data = sites_infos,
transect = "transect",
quadrat = "quadrat")
gg_chessboard(nodes)
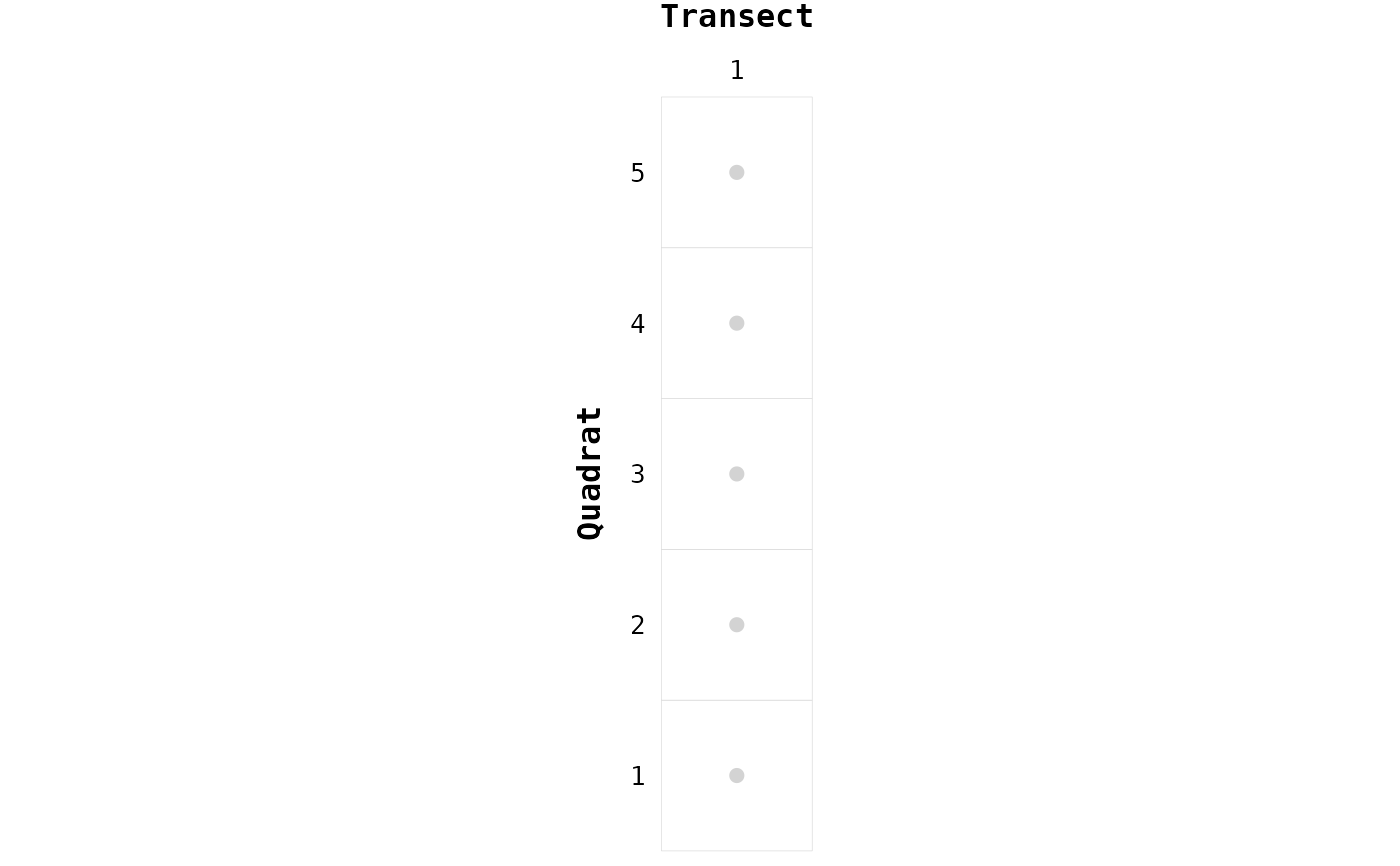
 # One-dimensional sampling (only transects) ----
sites_infos <- data.frame("transect" = 1:5)
nodes <- create_node_labels(data = sites_infos,
transect = "transect")
gg_chessboard(nodes)
# One-dimensional sampling (only transects) ----
sites_infos <- data.frame("transect" = 1:5)
nodes <- create_node_labels(data = sites_infos,
transect = "transect")
gg_chessboard(nodes)
 # One-dimensional sampling (only quadrats) ----
sites_infos <- data.frame("quadrat" = 1:5)
nodes <- create_node_labels(data = sites_infos,
quadrat = "quadrat")
gg_chessboard(nodes)
# One-dimensional sampling (only quadrats) ----
sites_infos <- data.frame("quadrat" = 1:5)
nodes <- create_node_labels(data = sites_infos,
quadrat = "quadrat")
gg_chessboard(nodes)