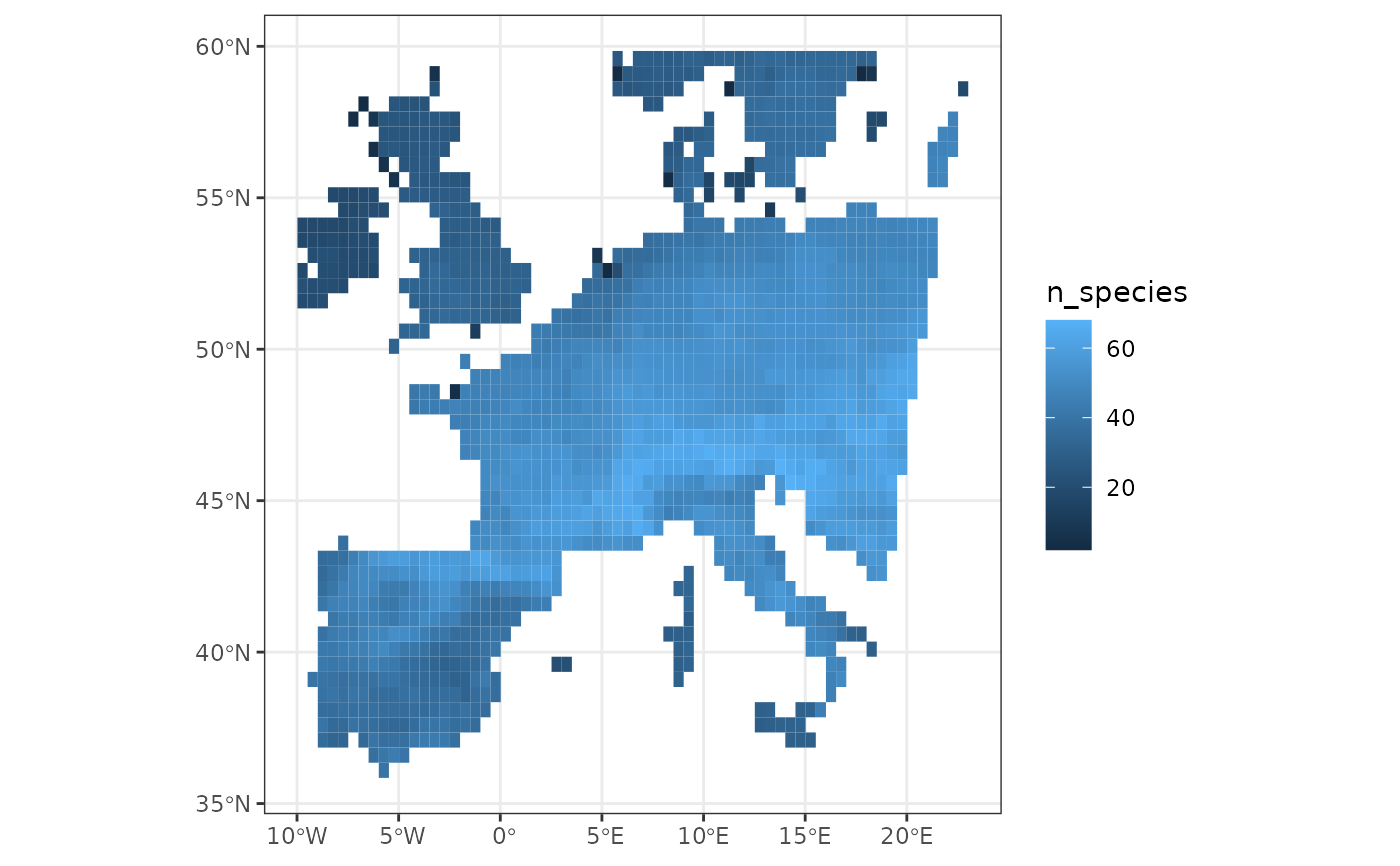
From the site-locations data and a dataset organized by site, plot a map of this information. The returned plot is as little customized as possible to let the user do the customization.
Arguments
- site_locations
an
sfobject with the spatial geometries of sites. NOTE: the first column should be named"site"and indicate site names.- site_data
data.frame()of additional site information containing the column"site"to merge with thesite_locationsargument- selected_col
character(1)name of the column to plot
Examples
site_rich <- fb_count_species_by_site(woodiv_site_species)

# Map of Species Richness
rich_map <- fb_map_site_data(woodiv_locations, site_rich, "n_species")
rich_map


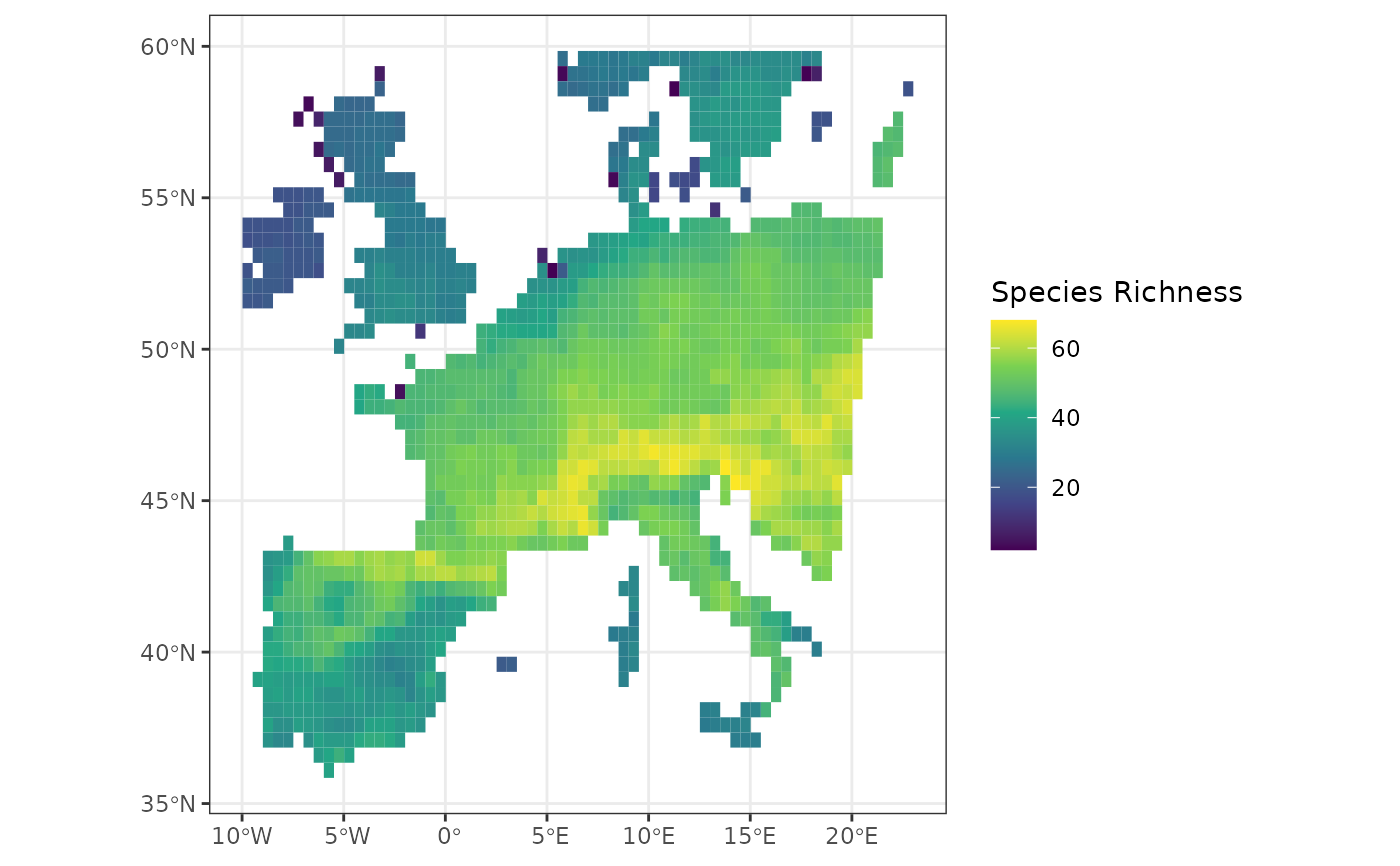
# Customize the map
rich_map +
  ggplot2::scale_fill_viridis_c("Species Richness")

