Map Trait Coverage Per Site
Source:R/fb_map_site_traits_completeness.R
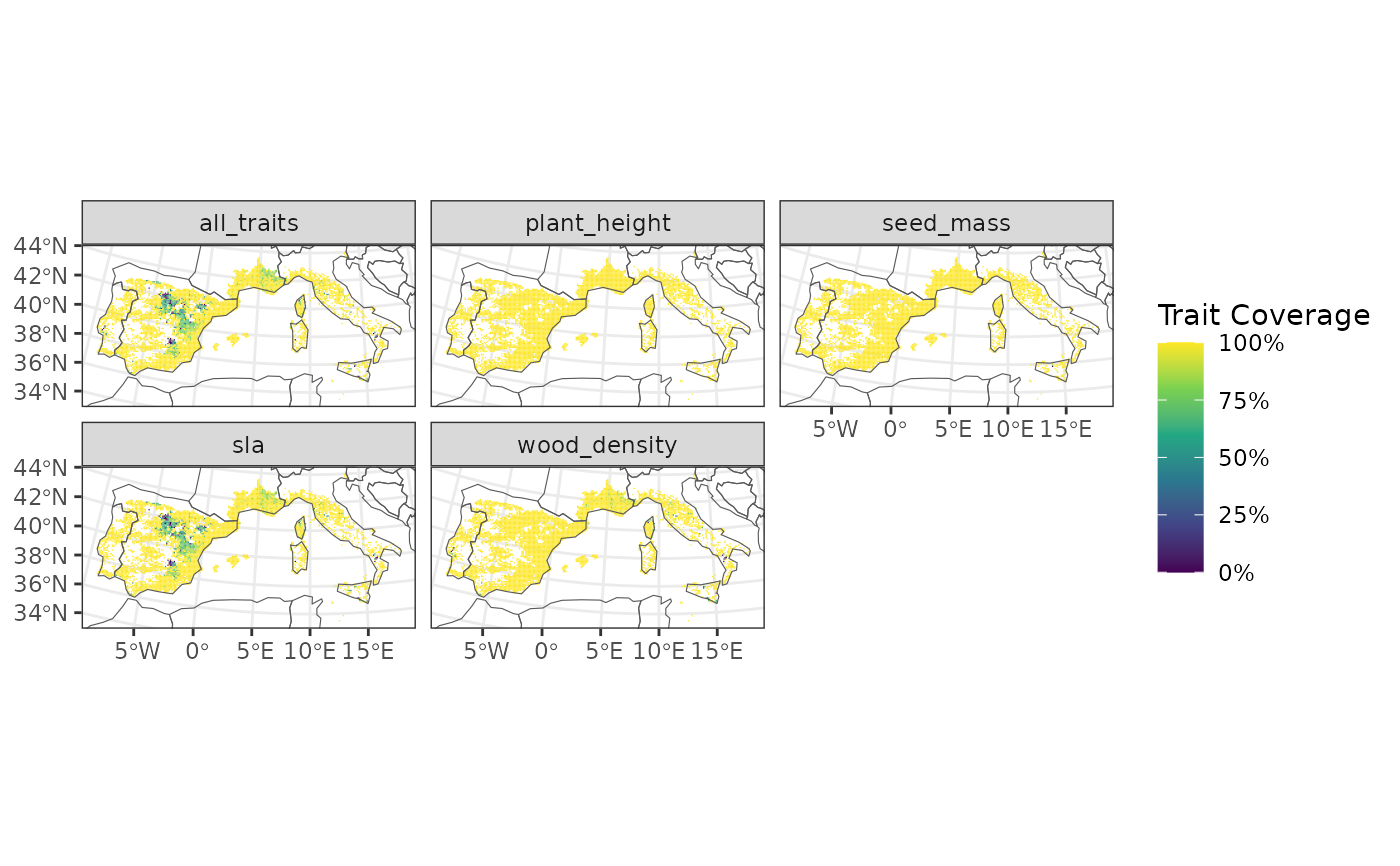
fb_map_site_traits_completeness.RdReturns a ggplot2 map of sites colored by trait coverage (proportion
of species having a known trait value). By default shows one plot for each
trait and add an additional facet named "all_traits" considering the
trait coverage with all provided traits taken together.
Usage
fb_map_site_traits_completeness(
  site_locations,
  site_species,
  species_traits,
  all_traits = TRUE,
  background = FALSE
)
Arguments
- site_locations
a
sfobject with the spatial geometries of sites. NOTE: the first column should be named"site"and indicate site names.- site_species
a
data.framewith sites in rows and species in columns. NOTE: the first column should be named"site"and indicate site names. The other columns should be named according to species names.- species_traits
a
data.framewith species in rows and traits as columns. NOTE: The first column should be named"species"and contain species names. The other columns should be named according to trait names.- all_traits
a logical (default =
TRUE) which tell if the coverage considering all provided traits should be provided in an additional columnall_traits- background
a
logical. IfTRUEadds a layer of country boundaries from Natural Earth.