Plot Number of Sites by Species
Source:R/fb_plot_number_sites_by_species.R
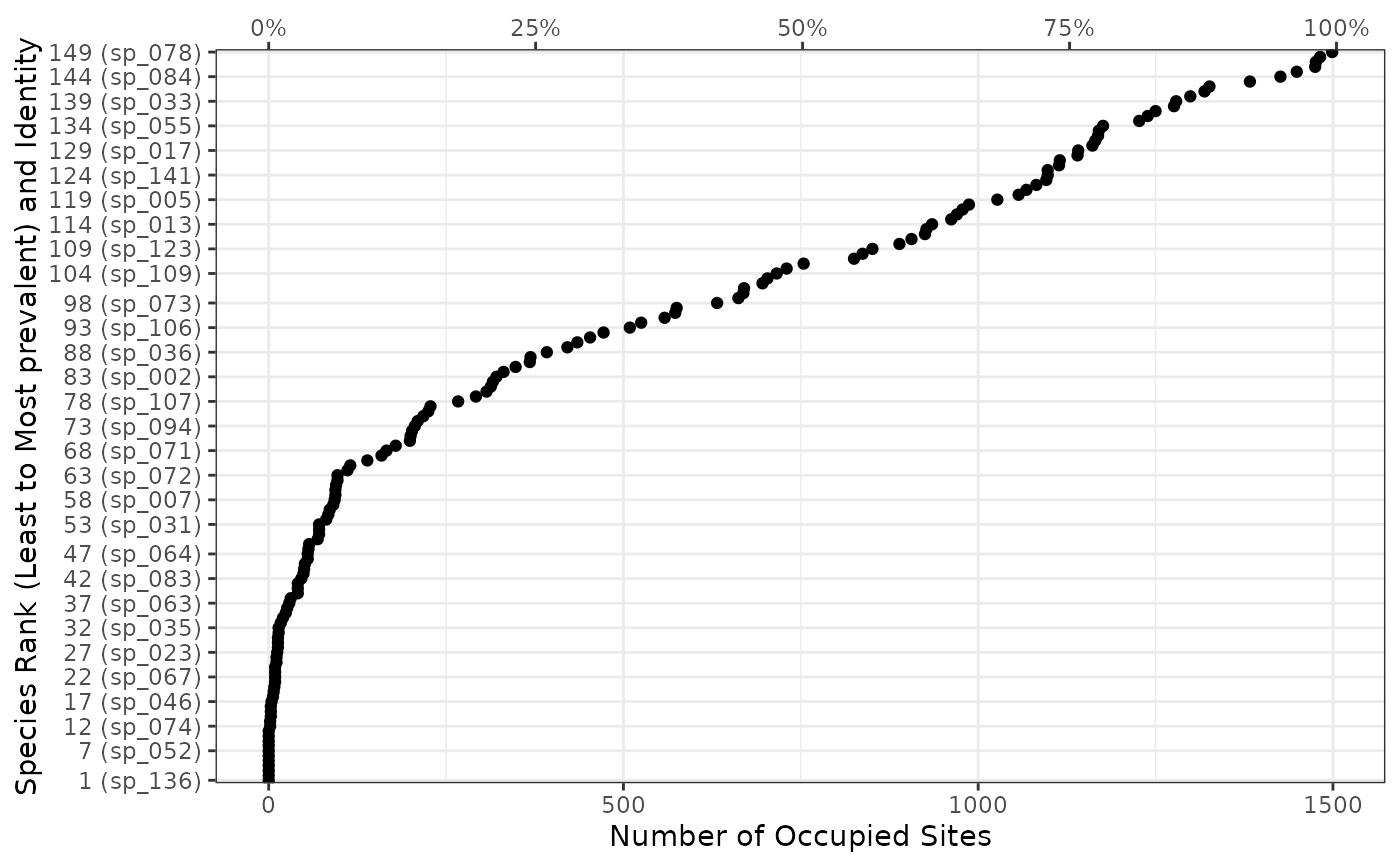
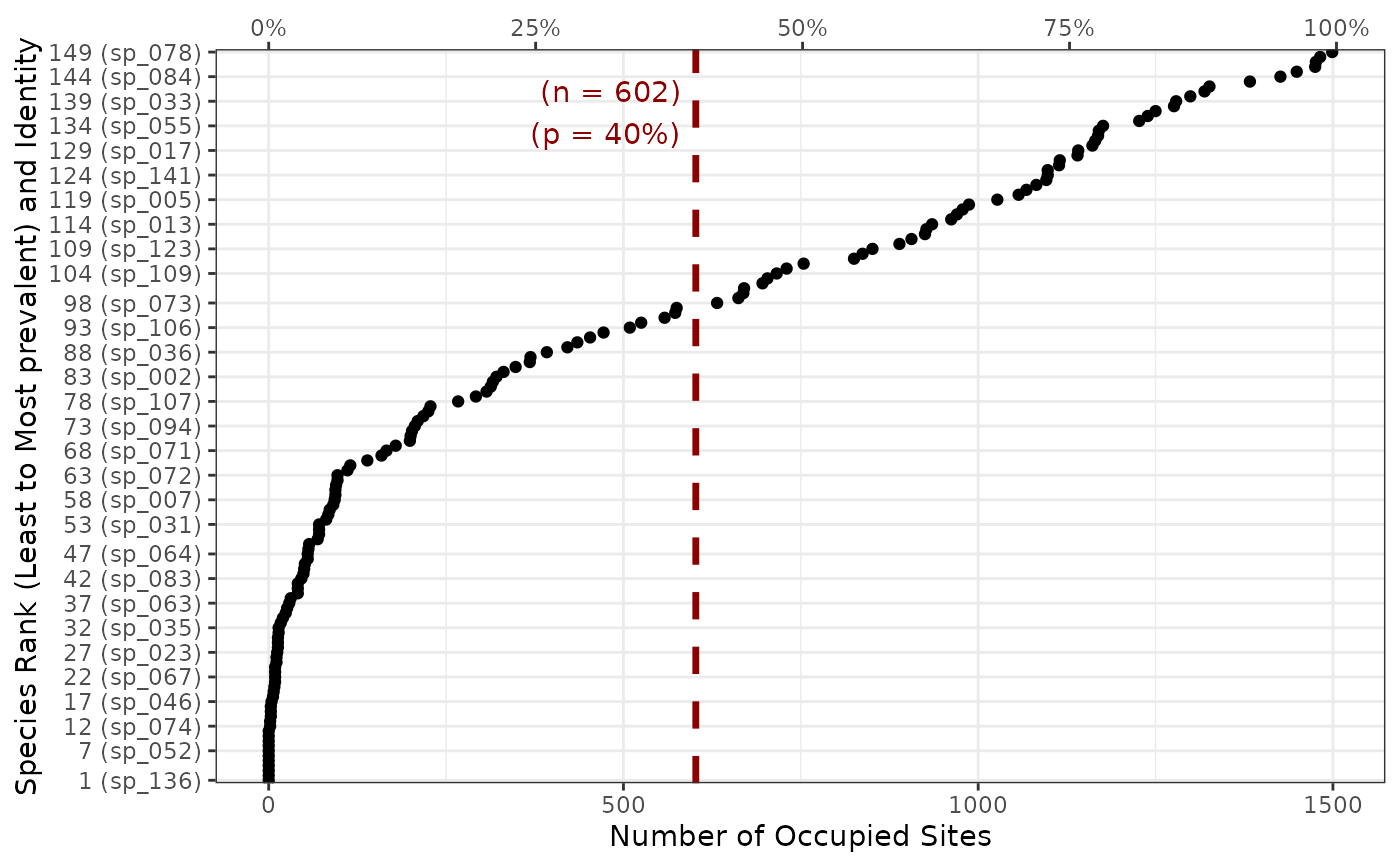
fb_plot_number_sites_by_species.RdRepresent all species in each function of the number of sites they occupy. The species are ordered from the ones that occupy the least number of sites from the ones that occupy the most. The number of site is indicated at the bottom x-axis, while the top x-axis represents the proportion of occupied sites. The left y-axis label species names and their rank by increasing prevalence. The user can supplied a threshold of sites to see how many species occupy more or less than the given proportion of sites.
Arguments
- site_species
a
data.framewith sites in rows and species in columns. NOTE: the first column should be named"site"and indicate site names. The other columns should be named according to species names.- threshold_sites_proportion
a numeric of length 1 between 0 and 1. The percentage of sites coverage threshold.

