Plot Number of Traits per Species
Source:R/fb_plot_number_traits_by_species.R
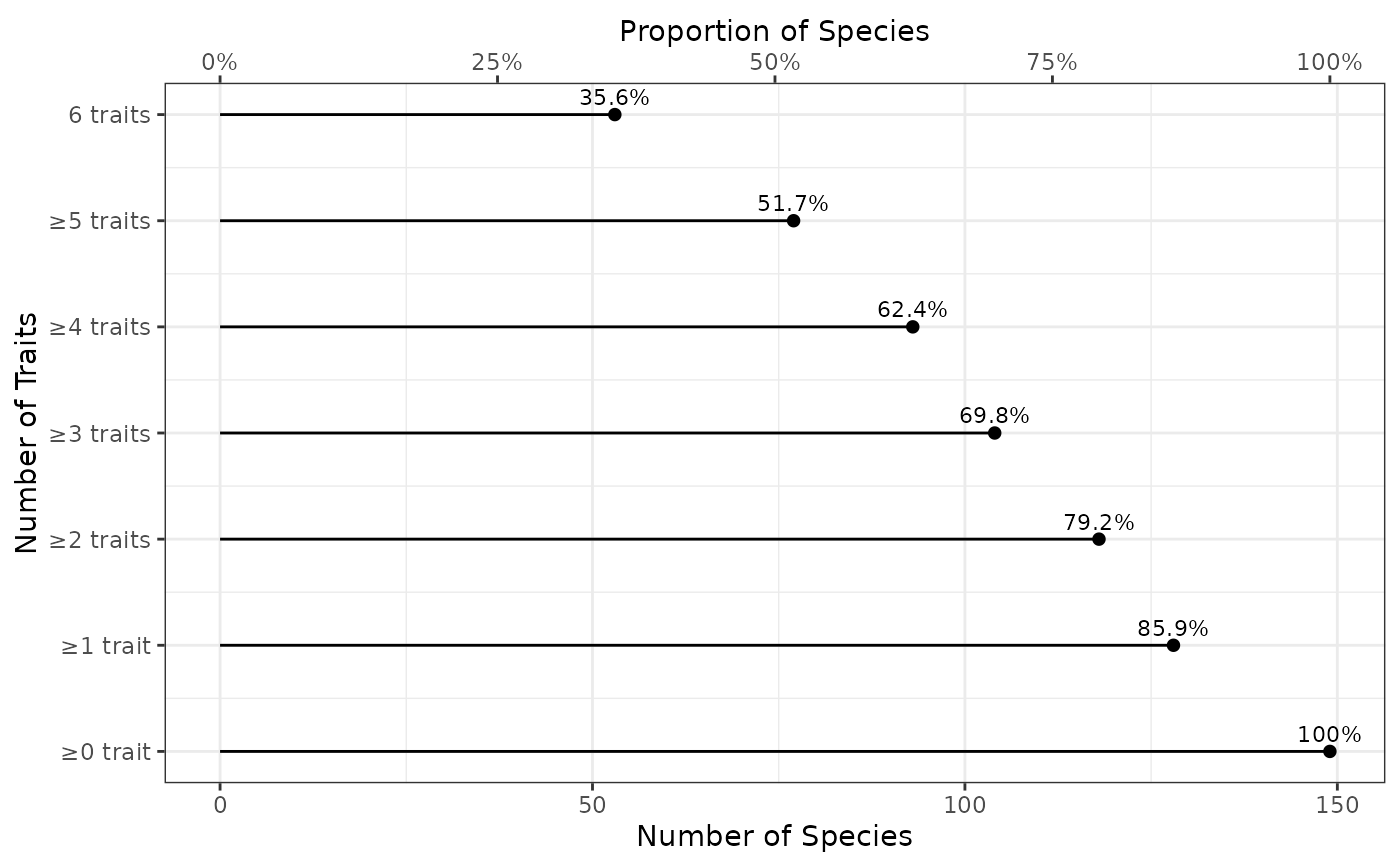
fb_plot_number_traits_by_species.RdDisplay a graph showing the number (and proportion) of species having at least 0, 1, etc. number of traits. It provides a lollipop graph to examine which number of trait cover a certain proportion of the species. This plot doesn't show which traits are concerned.
Usage
fb_plot_number_traits_by_species(
  species_traits,
  species_categories = NULL,
  threshold_species_proportion = NULL
)
Arguments
- species_traits
a
data.framewith species in rows and traits as columns. NOTE: The first column should be named"species"and contain species names. The other columns should be named according to trait names.- species_categories
(default =
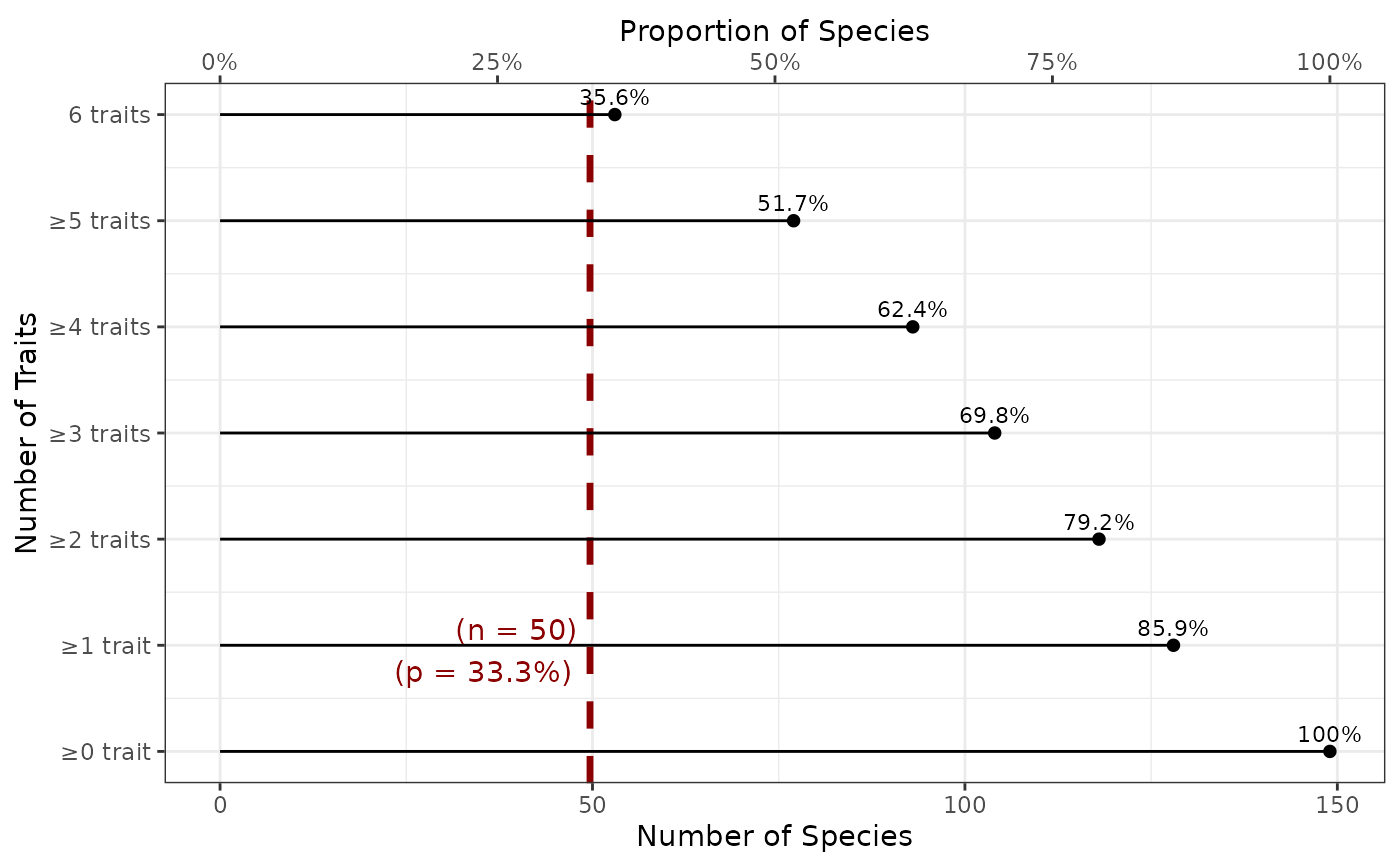
NULL) 2-columnsdata.framegiving species categories, with the first column describing the species name, and the second column giving their corresponding categories- threshold_species_proportion
numeric(1)[default =NULL]
between 0 and 1. The percentage of species coverage threshold.