Plot Trait Coverage per Species for each Trait
Source:R/fb_plot_species_traits_completeness.R
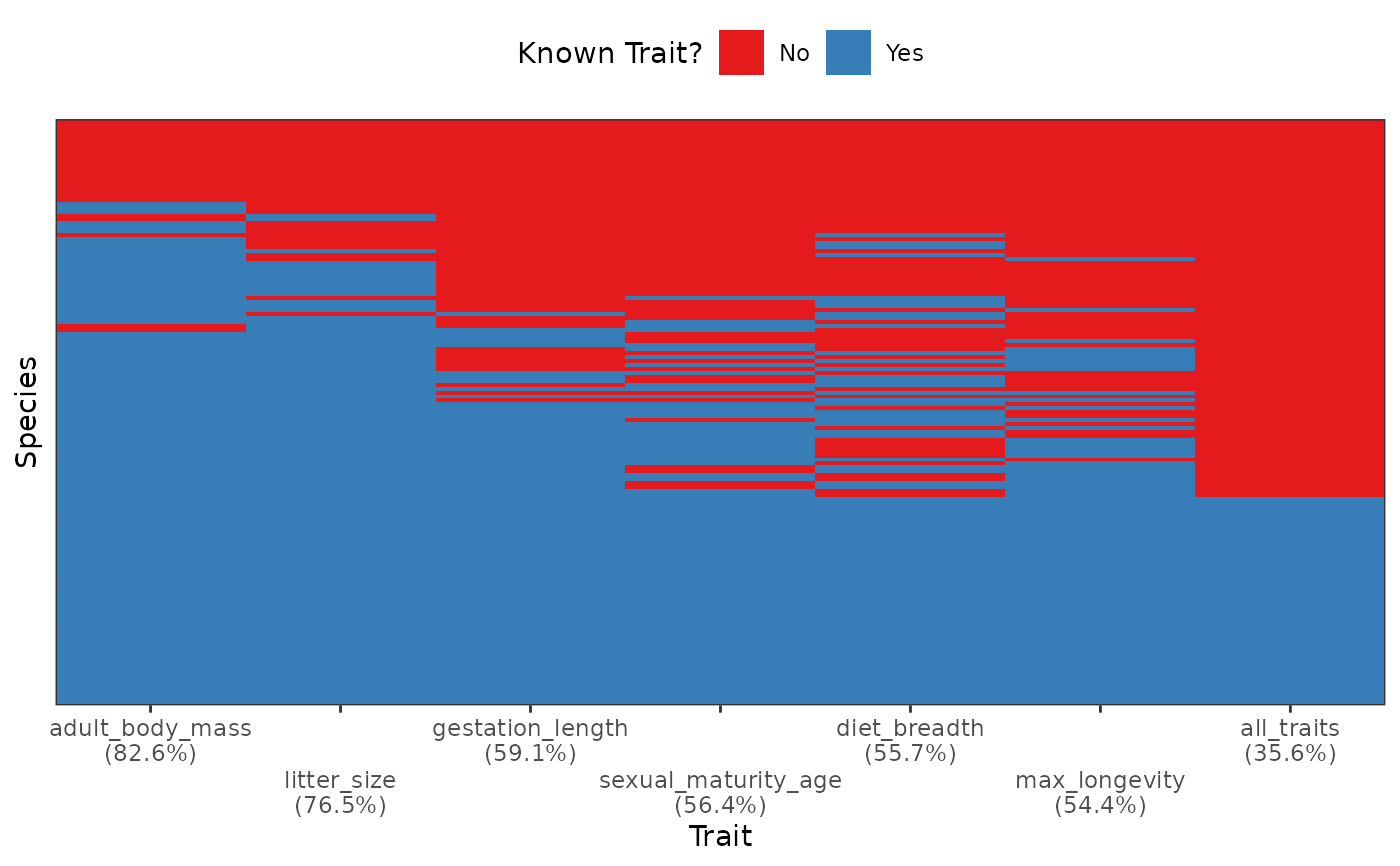
fb_plot_species_traits_completeness.RdDisplay a binary heatmap visualizing the species x traits matrix with colors
displaying present and missing traits. Traits are ordered from the most to
the least known (left to right).
Species are ordered from the ones with most to the ones with least traits
(bottom to top). The proportion of species with non-missing traits is shown
on the x-axis labels.
An additional column at the very right of the plot named "all_traits"
shows a summary considering if all other traits are known.
Usage
fb_plot_species_traits_completeness(
  species_traits,
  species_categories = NULL,
  all_traits = TRUE
)
Arguments
- species_traits
a
data.framewith species in rows and traits as columns. NOTE: The first column should be named"species"and contain species names. The other columns should be named according to trait names.- species_categories
(default =
NULL) 2-columnsdata.framegiving species categories, with the first column describing the species name, and the second column giving their corresponding categories- all_traits
a logical (default =
TRUE) which tell if the coverage considering all provided traits should be provided in an additional columnall_traits