Plot Present and Missing Trait Combinations Frequencies
Source:R/fb_plot_trait_combination_frequencies.R
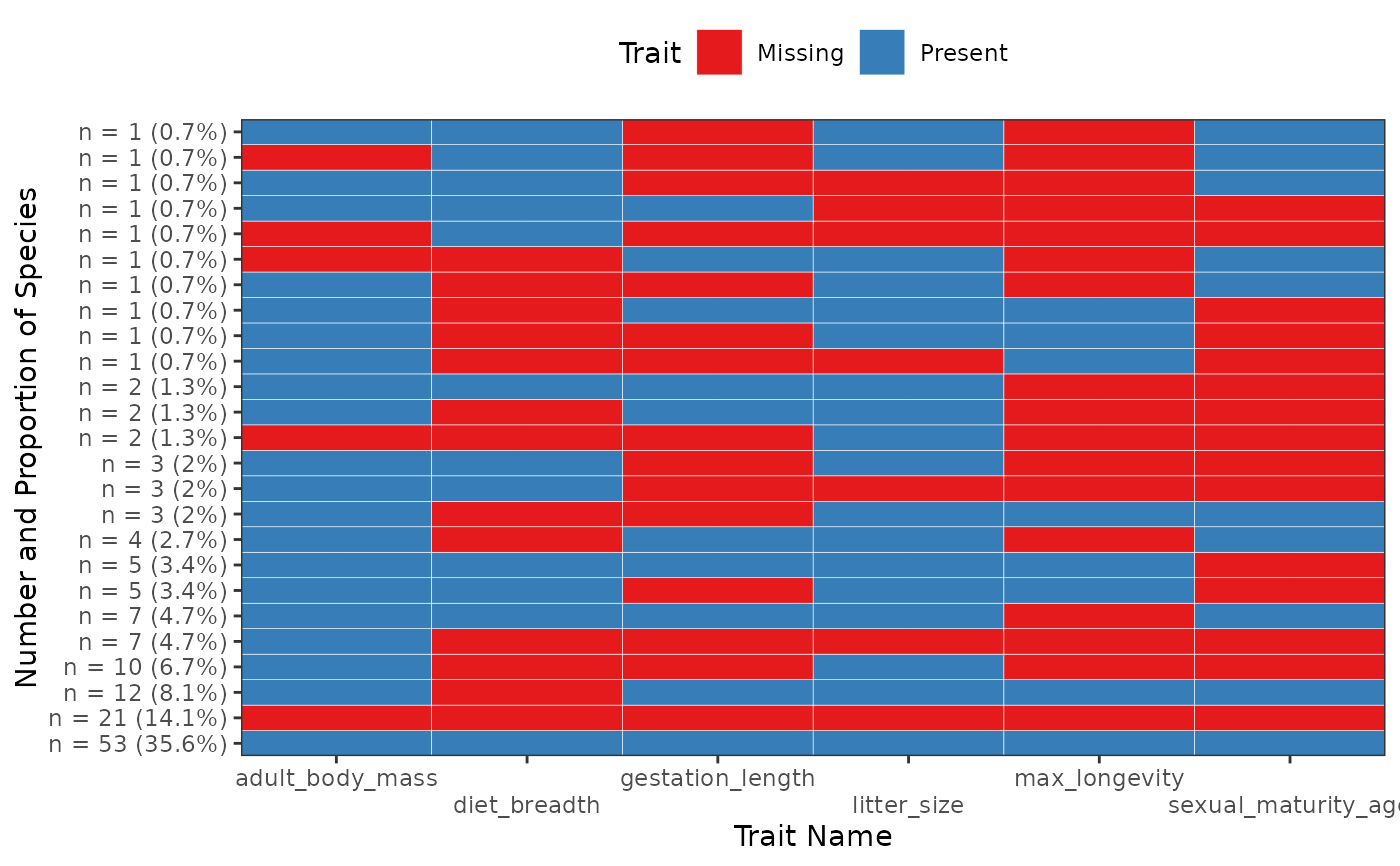
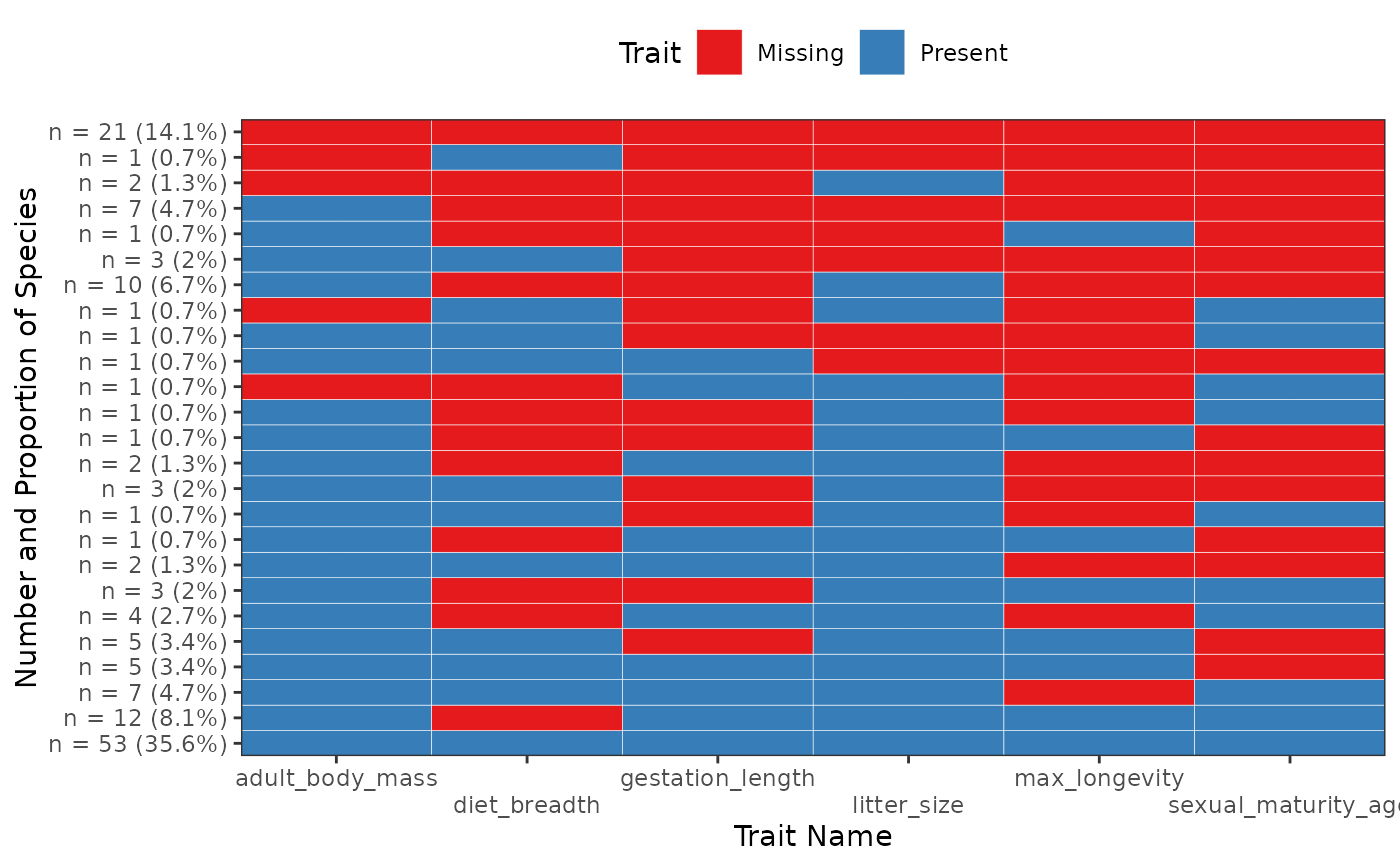
fb_plot_trait_combination_frequencies.RdDisplay a figure of Present/Missing Trait Combinations where one square is represents one trait. The y-axis gives the frequency of the row (as well as its proportions compared to the total number of rows).
Usage
fb_plot_trait_combination_frequencies(
  species_traits,
  species_categories = NULL,
  order_by = c("number", "complete")
)
Arguments
- species_traits
a
data.framewith species in rows and traits as columns. NOTE: The first column should be named"species"and contain species names. The other columns should be named according to trait names.- species_categories
(default =
NULL) 2-columnsdata.framegiving species categories, with the first column describing the species name, and the second column giving their corresponding categories- order_by
character(1)either"number"or"complete
If"number"order rows by frequency so that most frequent rows are at the bottom. Otherwise order rows to order table by the number of non-missing traits then by the frequency of combinations