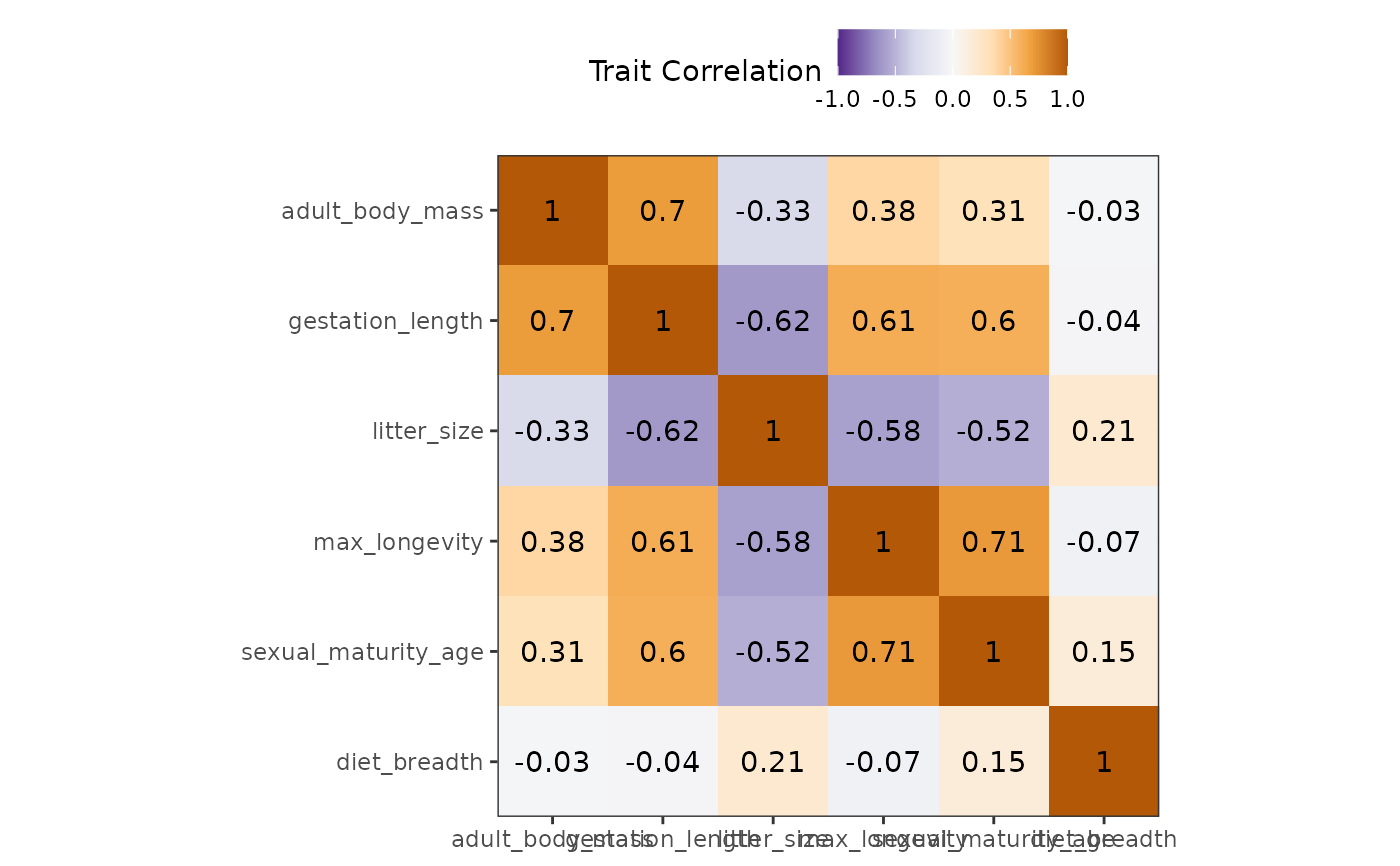
This functions outputs a ggplot2 figure that outputs a trait correlation
matrix. It only works on numerical traits and will output messages if
non-numerical traits are found and errors if no numerical traits are found.
Internally it uses the stats::cor() function and only works on complete
observation (it removes any row that contains any NA).
Use the ... argument to pass options to the cor() function.
Arguments
- species_traits
a
data.framewith species in rows and traits as columns. NOTE: The first column should be named"species"and contain species names. The other columns should be named according to trait names.- species_categories
(default =
NULL) 2-columnsdata.framegiving species categories, with the first column describing the species name, and the second column giving their corresponding categories- ...
Additional options passed to
stats::cor()